From Acquisition to Reporting: Step-by-Step
The use of NOTOCORD-hem™ for your studies can be divided in five major steps:
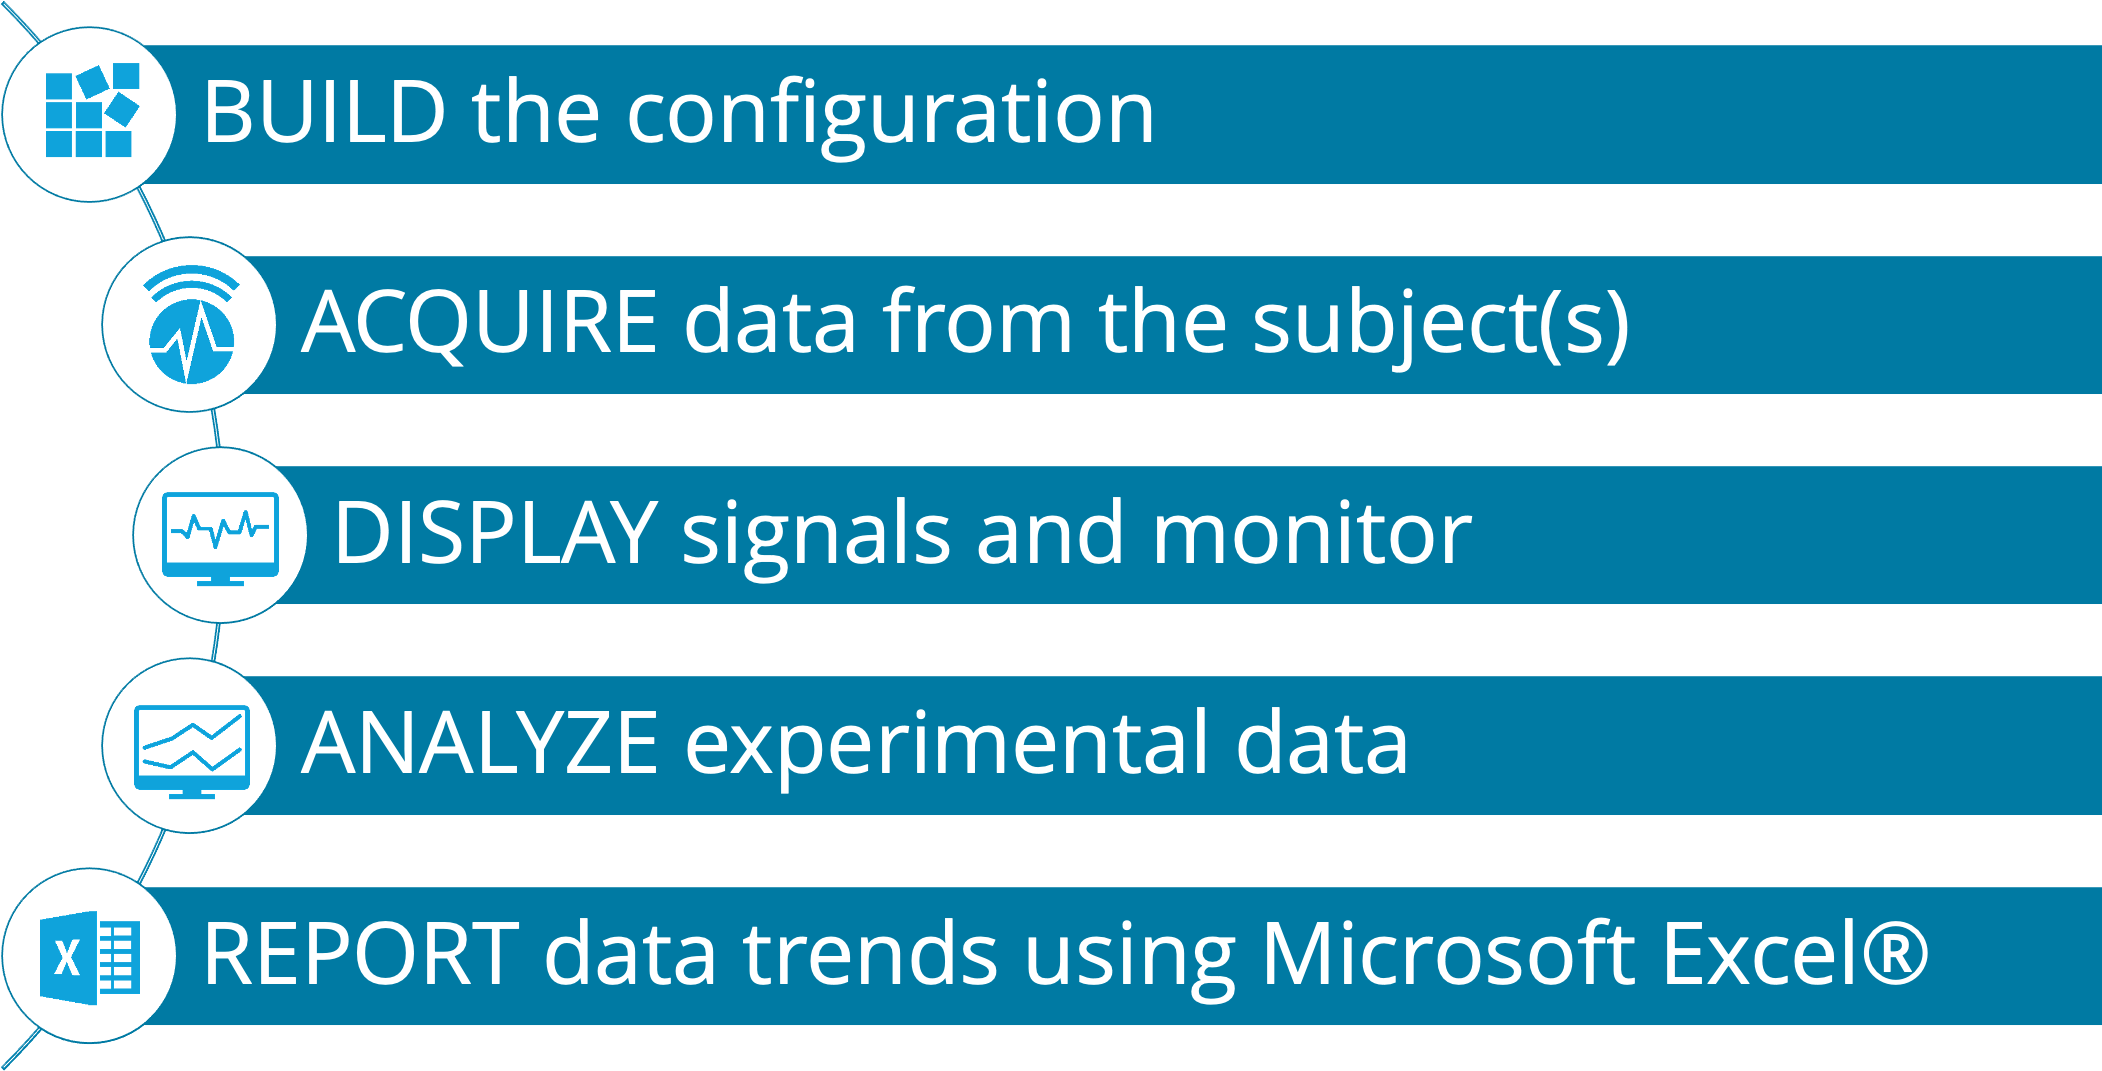
STEP 1 - Build the configuration
Building a configuration consists in linking modules of interest in order to assemble a system able to perform all acquisition, analysis and display tasks required for the experiment. The modules' parameters can be modified for a truly customized analysis.
Example configuration
The configuration below is built to acquire, analyze and display electroencephalogram and video signals.
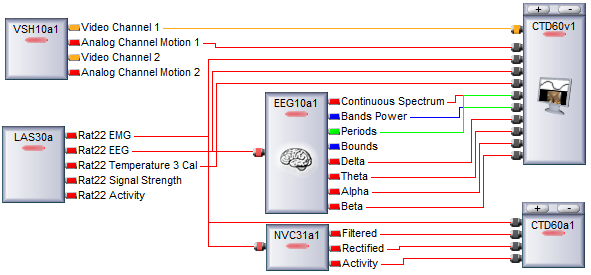
On the example configuration above:
- VSH10a is a video acquisition server connected to CTD60v, a universal chart display with video.
- LAS30a (acquisition) provides EMG and EEG signals, and some additional channels from the implant.
- The EMG signal is processed by a dedicated module NVC31a that removes the offset, rectifies the signal and calculates an activity index. All ouputs are connected to CTD60a, a multigraph continuous display.
- The EEG signal is processed by EEG10a, a spectrum analyzer extracting Delta, Theta, Alpha, and Beta bands on user-defined successive epochs. A filter bank is applied to the input signal and the band powers are measured in real time. Results are displayed on CTD60v, so the EEG signals can be inspected in synchronization with the video.
STEP 2 - Acquire experimental data
 Thanks to dedicated acquisition modules, NOTOCORD-hem™ is compatible with the main hardware on the market: Data Translation® USB A/D cards, DSI™, Hugo Sachs Electronik, Millar, Transonic®, TSE Stellar Telemetry, etc.
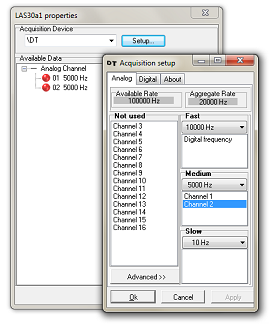
NOTOCORD-hem™ accepts a large number of input channels (upon hardware limitation). The input channels of interest are selected and configured by the user (range, sampling frequency, etc.).
About acquisition
- A file can include several acquisition periods which may last from a few seconds to several days
- Scheduled recording is possible for programmed acquisition periods
- Video recording and synchronization to analogue input channels is ensured thanks to our 4-/8-channel High-Definition video acquisition modules
- Event markers and comments can be inserted during acquisition
- Data review on previous periods is possible without interrupting data acquisition and online analysis
STEP 3 - Display signals
NOTOCORD-hem™ offers several types of display with advanced capabilities: continuous, digital, 2-D, 3-D, video... Signal display (style, color, thickness, etc.) is customizable to meet the user’s preferences.
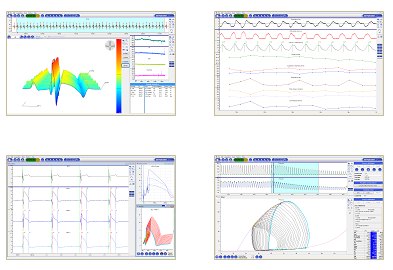
About display
- Graphical superimposition is available for data curves and tendencies comparison
- There are no limitations in the number of displays; each display may show up to 20 individual graphs
- Channels overlay is possible within the same display for flexible visualization of waveforms
STEP 4 - Analyze & review data
Real time and offline analysis
NOTOCORD® proposes an extensive library of signal processors and analyzers dedicated to cardiovascular, respiratory and nervous system signals as described in our Solutions and Catalog sections.
Nearly all analyzers can perform real time analysis. All data are permanently saved in the file and made available for immediate visual inspection and validation.
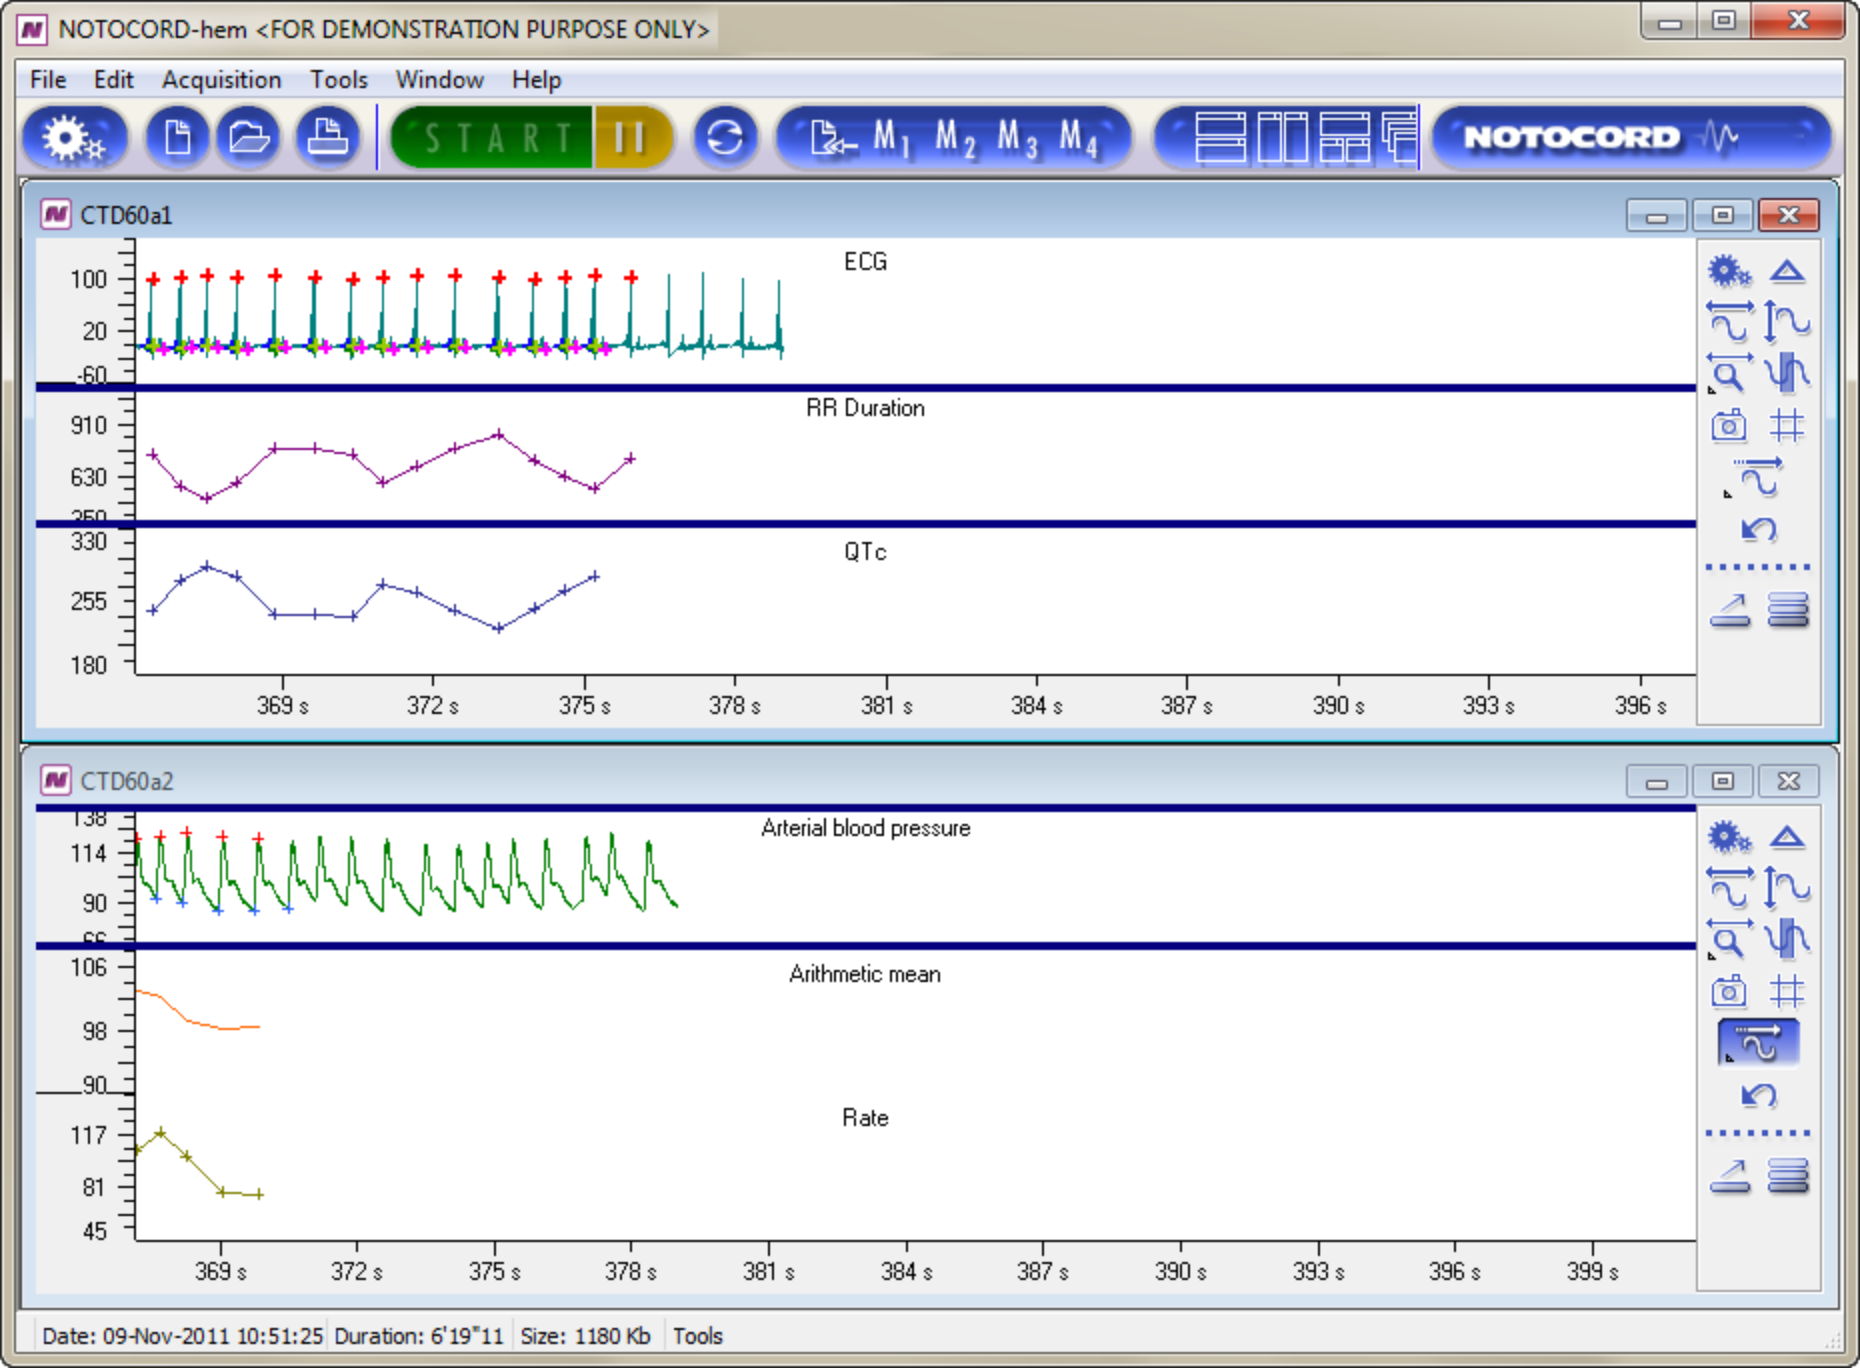
On the example above, the characteristic points of the EEG signal as well as RR duration and QTc values are computed during acquisition of the signal (top graphs). The same applies for the arterial blood pressure signal with the marking of systolic and diastolic pressure points and the computation of arithmetic mean and rate values.
Data review
- Real time data review is possible, i.e. during acquisition, without inducing interruptions.
- Offline data review, i.e. of files already acquired, is available instantly as large data files open in a few seconds and time-consuming replay is not needed.
Some of our modules modules have been designed specifically for editing and validation. E.g.: our Reference mark editor for arrhythmia RME10a used in association withour Arrhythmia detector ARR30a.
STEP 5 - Report in Microsoft Excel®
Thanks to the Excel wizard, a unique reporting system conceived by NOTOCORD®, data are extracted quickly and efficiently in Microsoft Excel®. This function is designed to drastically reduce the time needed to generate reports as users benefit from different time-saving assistants and may create their own extraction templates for further data extraction.
Traceability is ensured as the origin and location of the extracted data are included in the report.
Find out more about fast and easy reporting in Microsoft Excel®